Biostatistics for NEET PG PSM: Data Types, Mean-Median-Mode, SD, Normal Curve, p-Value, Errors, Tests
Start Here
🎯 Exam priority: Highest in PSM. Reviews of recent papers consistently name biostatistics as the single largest source of PSM questions — usually short concept questions or one-line calculations. Everything here was checked against the CDC's Principles of Epidemiology and WHO's Basic Epidemiology.
CBME mapping: CM 6 (basic statistics and its applications).
Types of Data
Scale | What it means | Example | Kind |
Nominal | Categories with no order | Blood group, district, alive/dead | Qualitative (categorical) |
Ordinal | Ranked categories, gaps not equal | Cancer stage, pain grade | Qualitative (categorical) |
Interval | Equal units, no true zero | Date, temperature in °C | Quantitative (continuous) |
Ratio | Equal units with a true zero | Height, weight, duration of illness | Quantitative (continuous) |
Nominal and ordinal variables are qualitative (categorical); interval and ratio variables are quantitative (continuous). The type of data decides the summary measure, the graph and the statistical test.
Central Tendency and Skewness
Measure | Definition | Best used when |
Arithmetic mean | Sum ÷ number of observations | Data are roughly symmetrical |
Median | Middle value after ranking | Data are skewed or have outliers (it is not affected by a few extreme values) |
Mode | Most frequent value | Describing the commonest category or value |
Geometric mean | Mean on a logarithmic scale | Data whose logarithms are normally distributed, e.g. antibody titres and other laboratory dilutions |
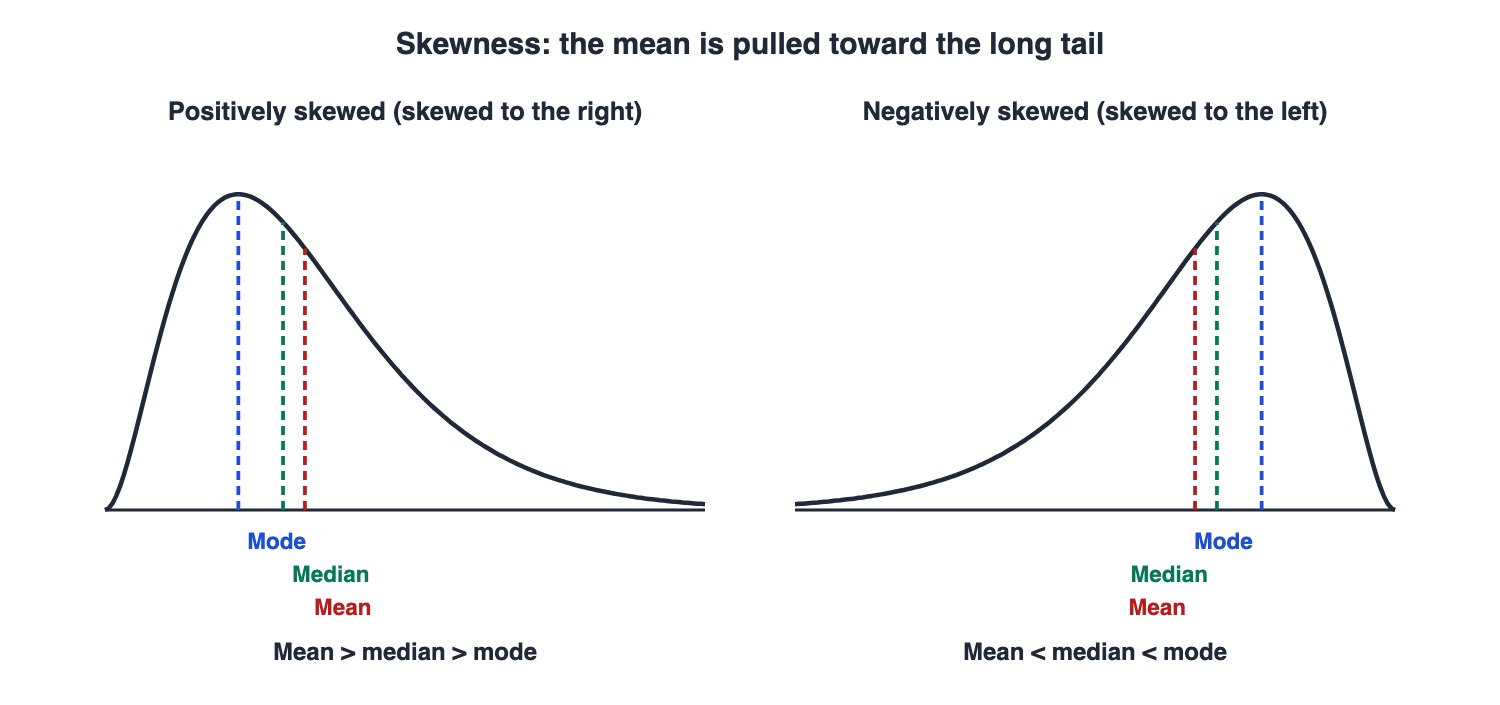
In a skewed distribution the mean is pulled toward the long tail: right-skewed data have mean > median > mode; left-skewed data the reverse.
Worked example
Incubation periods (days) in a small outbreak: 2, 3, 3, 4, 5, 6, 21.
Mean = 44 ÷ 7 = 6.3 days; median = 4 days; mode = 3 days.
One long incubation (21 days) drags the mean above the median, so the data are skewed to the right and the median is the better summary.
Spread and the Normal Curve
Measure of spread | Pairs with | Notes |
Range | Any | Maximum − minimum; sensitive to outliers |
Interquartile range | Median | 25th to 75th percentile — the middle half of the data |
Standard deviation | Mean | Typical distance of values from the mean; its square is the variance |
Standard error of the mean | Mean of a sample | SD ÷ √n — how precisely a sample mean estimates the population mean |
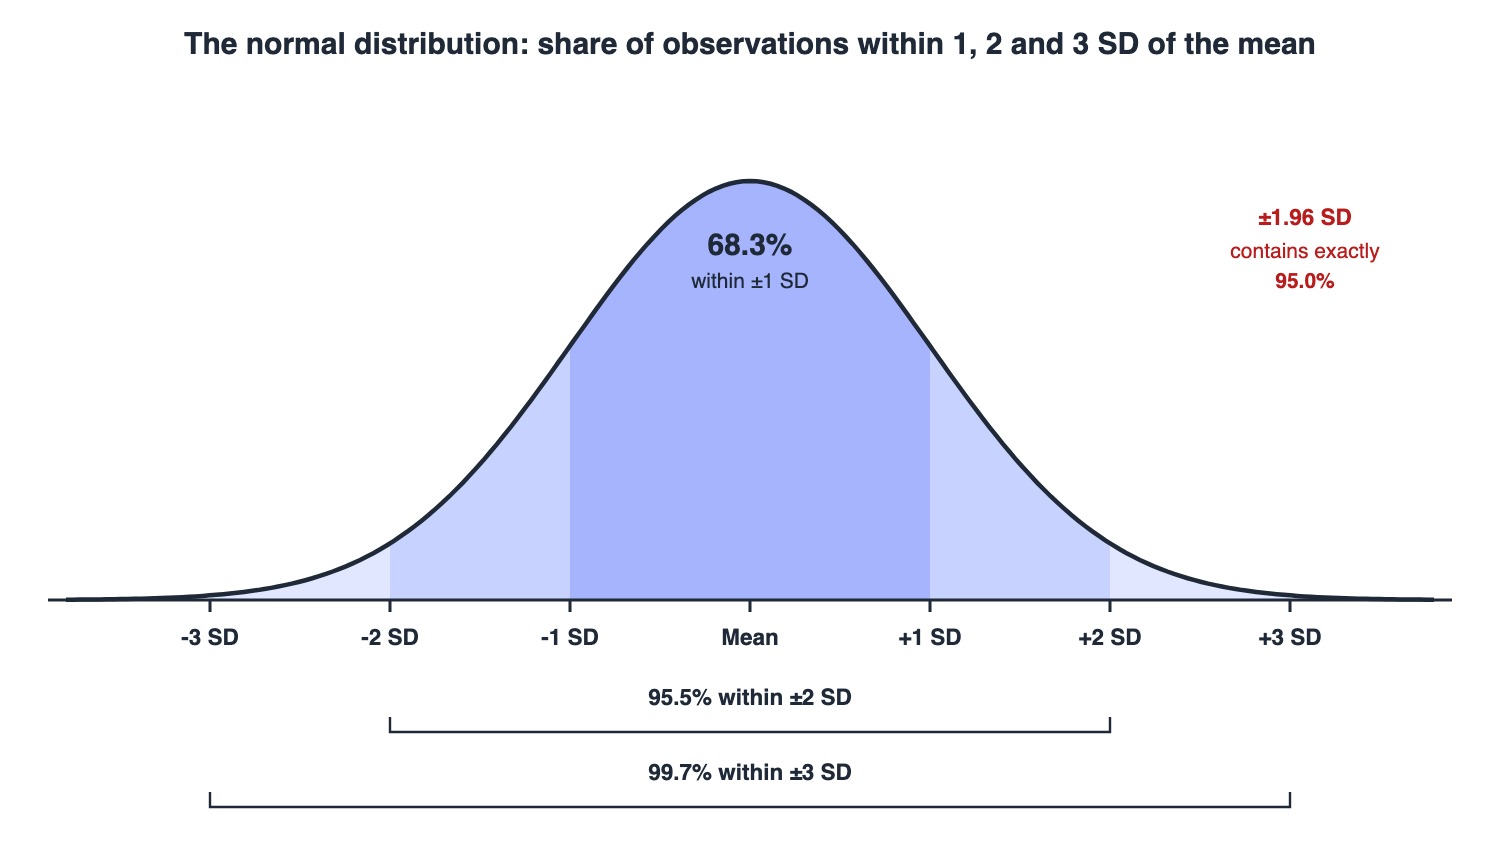
In a normal distribution 68.3% of observations lie within 1 SD of the mean, 95.5% within 2 SD and 99.7% within 3 SD; exactly 95.0% lie within 1.96 SD.
The normal curve is symmetrical, so its mean, median and mode coincide.
1.96 is the number behind every "95%" in statistics — 95% reference ranges and 95% confidence intervals.
Presenting Data: Which Graph?
Graph | Data | Key feature |
Histogram | Continuous variable in class intervals | Adjoining columns; area proportional to frequency |
Frequency polygon | Continuous frequency distribution | Points at interval mid-points joined by lines |
Bar chart | Categories | Bars of equal width, separated; no breaks in the scale |
Pie chart | Parts of one whole | Slice size shows each component's share |
Scatter diagram | Two continuous variables | Shows relationship (correlation) |
A histogram has no gaps between columns because the variable is continuous; a bar chart has gaps because the categories are separate.
From Sample to Population: Standard Error and Confidence Intervals
Inference starts with a random sample — every member of the population has an equal chance of selection.
Different samples give different means. The standard error (SD ÷ √n) measures how much sample means vary, and shrinks as the sample grows.
A 95% confidence interval ≈ mean ± 2 SE for samples above 30 (exactly 1.96 for very large samples). If we repeated the study many times, 95% of such intervals would contain the true population value.
Worked example (WHO's weight sample)
Ten weights give mean 67.9 kg and SD 10.2 kg. With n = 10 the multiplier from the t-distribution (9 degrees of freedom) is 2.26: 95% CI = 67.9 ± 2.26 × 10.2/√10 = 60.6 to 75.2 kg. A larger sample would give a narrower interval.
Hypothesis Testing, p-Values, Errors and Power
The null hypothesis states "no difference / no association". The p-value is the probability of a result at least as extreme as the one observed if the null were true. With α = 0.05, reject the null when p < 0.05.
Use a two-tailed test for routine epidemiological questions.
Null hypothesis true | Null hypothesis false | |
Reject the null | Type I (α) error — false alarm | Correct (power = 1 − β) |
Do not reject the null | Correct | Type II (β) error — missed difference |
Power (1 − β) is the chance of detecting a real difference. It rises with a larger sample and smaller variability; making α stricter (0.05 → 0.01) reduces power.
Choosing a Test
Question | Test | Note |
Do two group means differ? (e.g. mean Hb in two groups) | t-test (two-sample) | Continuous outcome, two groups |
Is there an association between two categorical variables? (exposed/unexposed × ill/well) | Chi-square test | df = (rows − 1) × (columns − 1); 3.84 is the 5% critical value for 1 df |
Do two continuous variables move together? | Correlation coefficient r | Ranges −1 to +1; measures linear association only |
Predict one variable from another | Regression | Linear (continuous outcome) or logistic (yes/no outcome) |
Degrees of freedom for a chi-square table = (r − 1) × (c − 1): a 2 × 3 table has 2 df; a 2 × 2 table has 1, for which a chi-square above 3.84 is significant at 5%.
Traps the Examiner Sets
Skewed data or outliers → median (with IQR), not mean (with SD).
Right (positive) skew: mean > median. Left (negative) skew: mean < median.
Type I = rejecting a true null (false positive); type II = missing a real difference. Power = 1 − β.
Correlation measures linear association only; r = 0 does not mean no relationship of any kind.
Standard deviation describes the spread of observations; standard error describes the precision of a mean.
Rapid-Revision Cards
Four scales of measurement
Nominal, ordinal (qualitative); interval, ratio (quantitative).
Ratio vs interval scale
Ratio has a true zero (height); interval does not (date, °C).
Average for skewed data
Median (with IQR).
Right (positive) skew
Mean > median > mode; long tail to the right.
Geometric mean is used for…
Log-normally distributed data, e.g. antibody titres.
Spread measure paired with mean
Standard deviation.
68.3 / 95.5 / 99.7
% within 1 / 2 / 3 SD of the mean.
1.96 SD
Contains exactly 95% of a normal distribution.
Standard error of mean
SD ÷ √n — precision of a sample mean.
95% CI for large samples
Mean ± 1.96 SE (≈ 2 SE above n = 30).
Type I error
Rejecting a true null (α).
Type II error
Failing to reject a false null (β).
Power
1 − β; up with larger n, lower variance; down with stricter α.
Compare two means
t-test.
Association between two categorical variables
Chi-square; df = (r−1)(c−1); 3.84 for 1 df at 5%.
Correlation coefficient range
−1 to +1; linear association only.
Sources
Sources
Facts in this article were checked against these documents.
Principles of Epidemiology in Public Health Practice, 3rd ed., Lessons 2 (summarizing data) and 4 (displaying data) — U.S. Centers for Disease Control and Prevention (public domain), 2006, updated 2012 (link)
Basic Epidemiology, 2nd ed. — Chapter 4: Basic biostatistics — World Health Organization, 2006 (link)
CBME Curriculum 2024, Vol. II — Community Medicine (CM 6) — National Medical Commission, 2024
Test Yourself: Practice Questions
Eighteen questions in NEET PG style.
Practice Questions (NEET PG pattern)
Original questions written in the style of the exam: +4 for a correct answer, −1 for a wrong one. Every answer was checked against the sources listed above. NEET PG papers are not published by NBEMS, so these are not past-paper questions.
Q1. Stage of cancer (I, II, III, IV) is measured on which scale?
(a) Nominal
(b) Interval
(c) Ratio
(d) Ordinal
Show answer
Answer: (d) — Ordinal variables can be ranked but the gaps between ranks are not necessarily equal.
Q2. Height in centimetres is an example of which scale?
(a) Ratio
(b) Ordinal
(c) Interval
(d) Nominal
Show answer
Answer: (a) — A ratio scale has equal units and a true zero point, e.g. height or duration of illness.
Q3. Incubation periods in an outbreak are 2, 3, 3, 4, 5, 6 and 21 days. The best measure of central tendency is the
(a) median
(b) geometric mean
(c) range
(d) arithmetic mean
Show answer
Answer: (a) — One extreme value (21) pulls the mean; the median is not affected by a few extreme values.
Q4. In a distribution where the mean is greater than the median, the data are
(a) bimodal
(b) skewed to the left
(c) skewed to the right (positively skewed)
(d) normally distributed
Show answer
Answer: (c) — If the mean is higher than the median, the distribution is skewed to the right.
Q5. The most appropriate average for antibody titres measured in serial dilutions is the
(a) geometric mean
(b) harmonic mean
(c) mode
(d) arithmetic mean
Show answer
Answer: (a) — The geometric mean is used when the logarithms of the observations are normally distributed — typical of laboratory dilution data.
Q6. The measure of spread most commonly reported with the median is the
(a) standard error
(b) standard deviation
(c) interquartile range
(d) variance
Show answer
Answer: (c) — The interquartile range (25th–75th percentile) is used most commonly with the median.
Q7. In a normal distribution, approximately what percentage of observations lie within ±2 standard deviations of the mean?
(a) 95.5%
(b) 68.3%
(c) 50%
(d) 99.7%
Show answer
Answer: (a) — 68.3% lie within 1 SD, 95.5% within 2 SD and 99.7% within 3 SD.
Q8. Exactly 95% of observations in a normal distribution lie within how many standard deviations of the mean?
(a) 2.58
(b) 1
(c) 1.96
(d) 3
Show answer
Answer: (c) — Exactly 95.0% of the data fall within 1.96 SD of the mean.
Q9. Which graph is used for a continuous variable grouped into class intervals, with adjoining columns?
(a) Histogram
(b) Bar chart
(c) Scatter diagram
(d) Pie chart
Show answer
Answer: (a) — A histogram shows the frequency distribution of a continuous variable using adjoining columns.
Q10. The relationship between body-mass index and systolic blood pressure in 200 adults is best shown by a
(a) frequency polygon
(b) pie chart
(c) bar chart
(d) scatter diagram
Show answer
Answer: (d) — A scatter diagram portrays the relationship between two continuous variables.
Q11. Increasing the sample size of a study will
(a) reduce the power
(b) narrow the confidence interval
(c) increase the standard error
(d) widen the confidence interval
Show answer
Answer: (b) — A larger sample gives a smaller standard error and a shorter confidence interval (and more power).
Q12. Rejecting the null hypothesis when it is actually true is a
(a) type II (β) error
(b) sampling bias
(c) type I (α) error
(d) confounding error
Show answer
Answer: (c) — A type I or α-error is rejecting a true null hypothesis; its probability is set by the α-level.
Q13. The power of a study equals
(a) 1 − β
(b) α
(c) β
(d) 1 − α
Show answer
Answer: (a) — Power — the chance of rejecting the null when it should be rejected — is 1 − β.
Q14. Changing the significance level from 0.05 to 0.01, other things equal, will
(a) increase the power
(b) eliminate type II errors
(c) reduce the power of the study
(d) not change the power
Show answer
Answer: (c) — A stricter α makes it harder to reject the null, so power falls.
Q15. To compare the mean haemoglobin of pregnant women in two districts, the appropriate test is the
(a) correlation coefficient
(b) Kaplan–Meier analysis
(c) chi-square test
(d) t-test
Show answer
Answer: (d) — The two-sample t-test asks whether two sample means are sufficiently different.
Q16. To test whether vaccination status (yes/no) is associated with getting measles (yes/no), use the
(a) linear regression
(b) paired t-test
(c) t-test
(d) chi-square test
Show answer
Answer: (d) — Associations between categorical variables in a cross-table are tested with chi-square; for a 2×2 table, χ² above 3.84 is significant at 5%.
Q17. The degrees of freedom for a chi-square test on a 2 × 3 table are
(a) 6
(b) 3
(c) 1
(d) 2
Show answer
Answer: (d) — df = (rows − 1) × (columns − 1) = 1 × 2 = 2.
Q18. The Pearson correlation coefficient r
(a) can only be positive
(b) ranges from −1 to +1 and measures linear association
(c) ranges from 0 to 1
(d) measures causation
Show answer
Answer: (b) — r measures linear association and ranges between −1 and +1.
Active Recall
From memory: name the four scales with an example each; say which average and which spread measure to use for skewed and for symmetrical data; draw the normal curve with its percentages; define type I and II errors and power; and match t-test, chi-square, correlation and regression to the question each answers.