Demography and Vital Statistics for NEET PG PSM: SRS 2024, NFHS-6, MMR 87, Fertility and Mortality Calculations
Start Here
🎯 Exam priority: High for calculations, medium for numbers. Expect a rate to work out from a short data set, a question on which denominator belongs to which rate, and a current-figure question. Everything here uses the newest official releases: SRS 2024, MMR 2022-24 and NFHS-6.
CBME mapping: CM 9.1–9.7 (demographic cycle, indices, sex ratio, population dynamics, population control, National Population Policy, sources of vital statistics). Contraceptive methods themselves are in the Family Planning article.
India in One Table
Indicator (India) | Value | Highest / lowest among bigger States/UTs |
Crude birth rate, 2024 | 18.3 per 1,000 (rural 20.2, urban 14.7) | Bihar 26.8 / Kerala 11.1 |
Crude death rate, 2024 | 6.4 per 1,000 (rural 6.8, urban 5.6) | Chhattisgarh 8.4 / Delhi 4.5 |
Natural growth rate, 2024 | 11.9 per 1,000 | — |
Total fertility rate, 2024 | 1.9 (rural 2.1, urban 1.5) | Bihar 2.9 / Delhi 1.2 |
Infant mortality rate, 2024 | 24 per 1,000 live births (rural 27, urban 17) | Chhattisgarh 36 / Kerala 8 |
Neonatal mortality rate, 2024 | 18 per 1,000 live births | — |
Under-five mortality rate, 2024 | 28 per 1,000 live births | — |
Maternal mortality ratio, 2022-24 | 87 per 1,00,000 live births (95% CI 78–95) | Uttar Pradesh 154 / Kerala 24 |
Sex ratio at birth, 2022-24 | 918 females per 1,000 males | Chhattisgarh 978 / Uttarakhand 872 |
Life expectancy at birth, 2020-24 | 70.6 years (male 68.7, female 72.8) | Kerala 75.6 / Chhattisgarh 64.7 |
The crude birth rate fell from 36.9 in 1971 to 18.3 in 2024, and the crude death rate from 14.9 to 6.4. One infant in 42 still dies within a year of birth, and 52.7% of infant deaths happen in the first week.
Where the Numbers Come From
Source | Who and how | How often | What it gives |
Census | Registrar General and Census Commissioner, under the Census Act 1948. Complete count at a reference date | Every 10 years (2011 was the 15th since 1872; next is 2027) | Population size, age, sex, literacy, area-level data |
Sample Registration System (SRS) | Registrar General. Dual record: a resident part-time enumerator counts births and deaths continuously; a full-time supervisor surveys every six months; the two lists are matched | Annual (pilot 1964-65, full scale 1969-70); 8,839 sample units in 2024 | CBR, CDR, TFR, IMR, NMR, U5MR, MMR, life tables at national and state level |
Civil Registration System (CRS) | Registration of Births and Deaths Act 1969, amended 2023. Continuous, permanent, compulsory | Continuous; annual report | Registered births, deaths, stillbirths; birth registration level 99.1% in 2024 |
National Family Health Survey (NFHS) | MoHFW with IIPS Mumbai as nodal agency. Household survey with biomarkers | Periodic rounds: NFHS-5 2019-21, NFHS-6 2023-24 | Fertility, family planning, antenatal care, delivery, vaccination, nutrition, anaemia, blood sugar and blood pressure |
The SRS method is self-checking: matching two independent lists removes duplicates and shows how much each list missed. Verbal autopsy forms are completed for confirmed deaths. The curriculum also names NSSO surveys as a source.
Census 2027 (Gazette S.O. 4919(E), 5 September 2026): the reference date is 00:00 hours of 1 March 2027, with two exceptions: 1 October 2026 for Ladakh and the snow-bound areas of Jammu and Kashmir, Himachal Pradesh and Uttarakhand, and 5 January 2027 for Goa, Uttar Pradesh, Punjab and the rest of Uttarakhand.
Civil registration rules that get tested
Report births and deaths within 21 days, and register them at the place of occurrence.
Form 1 live birth, Form 2 death, Form 3 stillbirth.
The head of the household reports events at home; the medical officer in charge reports events in a hospital.
After one year, registration needs an order from a magistrate. A birth can be registered without the child's name.
For anyone born on or after 1 October 2023, the birth certificate is the single document proving date and place of birth.
The Demographic Cycle
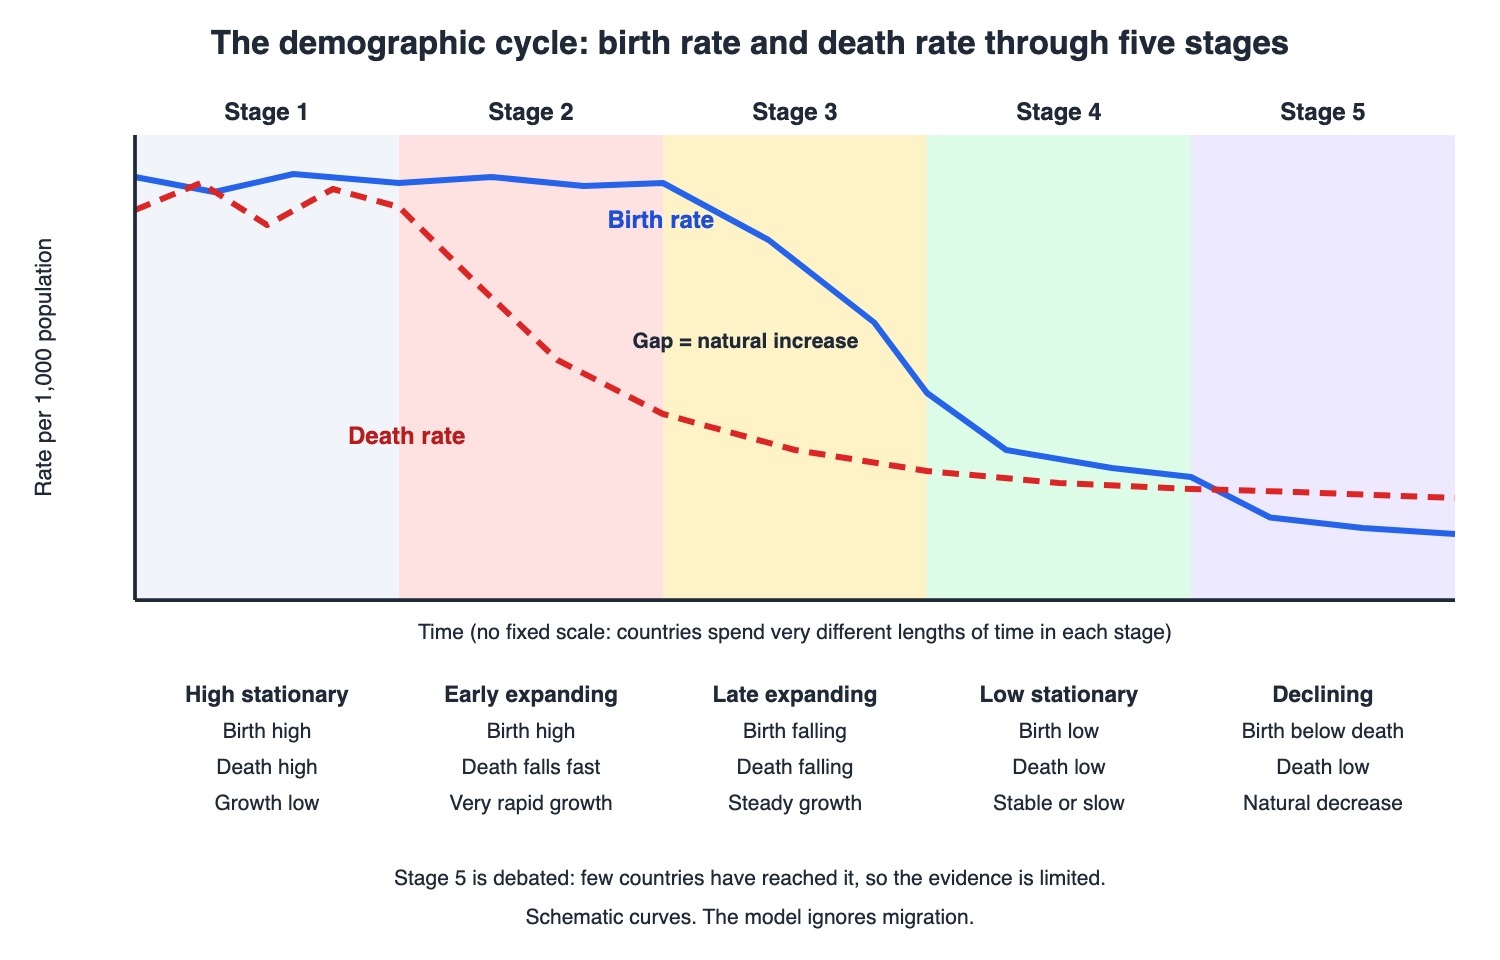
The five stages. The gap between the two curves is natural increase; it is widest in stage 2. Curves are schematic.
Stage 1, high stationary: birth and death rates both high and fluctuating; natural increase low.
Stage 2, early expanding: death rate falls fast while the birth rate stays high; very rapid increase.
Stage 3, late expanding: birth rate now falling too; steady increase.
Stage 4, low stationary: both low; stable or slow increase.
Stage 5, declining: birth rate below death rate; natural decrease. Few countries are here and the stage is debated.
Reading India: a birth rate of 18.3 that is still falling, a low death rate of 6.4 and a natural growth rate of 11.9 show a population still growing, but more slowly each decade. That pattern fits the late expanding stage moving towards low stationary. This is a reading of the numbers, not an official label: the RGS guide still lists India as a stage 2 example. The model has limits: it was built on Western Europe and North America, sets no time scale and ignores migration.
Fertility Measures
Index | Formula | India 2024 (SRS) | What to remember |
Crude birth rate | Live births in the year ÷ mid-year population × 1,000 | 18.3 | Crude: the denominator includes men, children and the elderly |
General fertility rate | Live births ÷ mid-year women aged 15–49 × 1,000 | 63.6 | Better than CBR: only women who can bear children are in the denominator |
Age-specific fertility rate | Live births to women of an age group ÷ mid-year women of that age group × 1,000 | Peak 134.7 at 25–29 | Each five-year band has its own rate |
Total fertility rate | 5 × sum of the ASFRs ÷ 1,000 | 1.9 | Children per woman if she lives through today's rates; not affected by age structure |
Gross reproduction rate | 5 × sum of the ASFRs for female births ÷ 1,000 | 0.9 | Daughters per woman, mortality ignored |
Net reproduction rate | As GRR, with the mortality of the same period applied | Not published in SRS | Daughters per woman, mortality included. NRR of 1 means exact replacement |
Worked example: TFR from the 2024 SRS rates. Age-specific rates per 1,000 women: 10.9, 105.5, 134.7, 78.3, 33.0, 11.0, 3.5 (ages 15–19 to 45–49). Their sum is 376.9. Multiply by 5, because each band is five years wide: 1,884.5 births per 1,000 women. Divide by 1,000: 1.88, published as 1.9.
Replacement level is a TFR of 2.1, or an NRR of 1. India's TFR is below 2.1 in SRS (1.9) and NFHS-6 (2.0); the two differ in method and period, so quote each with its source.
Education and fertility: TFR is 3.2 among illiterate women and 1.6 among graduates. Mean age at effective marriage for women is 23.1 years.
Mortality Measures
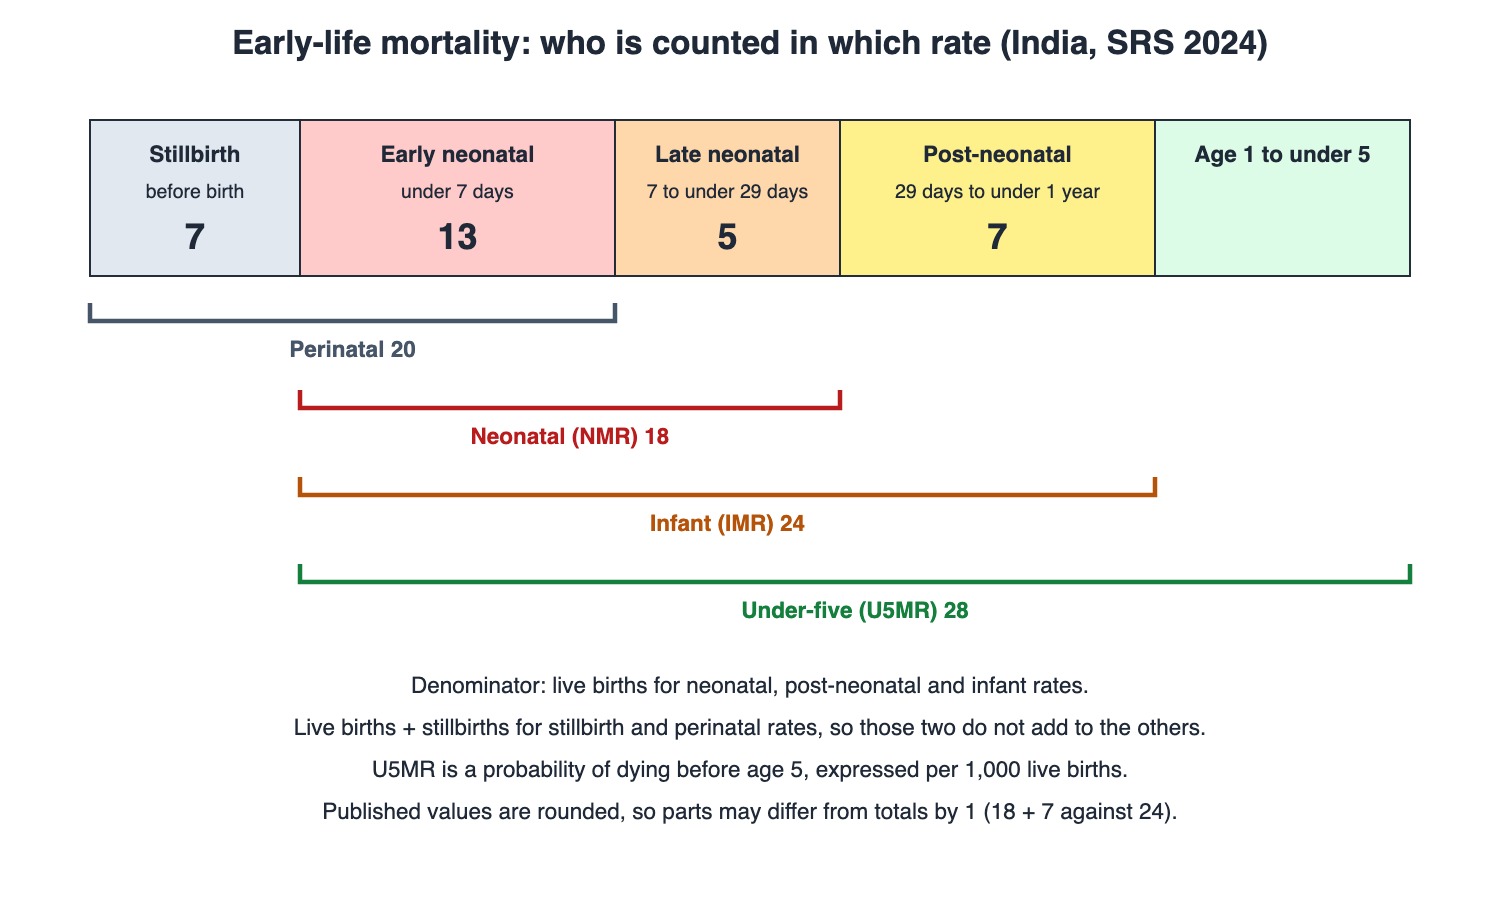
Who is counted in each rate, with SRS 2024 values. Note the different denominator for stillbirth and perinatal rates.
Measure | Numerator | Denominator | India (SRS) |
Crude death rate | Deaths in the year | Mid-year population (× 1,000) | 6.4 |
Infant mortality rate | Deaths under 1 year | Live births (× 1,000) | 24 |
Neonatal mortality rate | Deaths under 29 days | Live births (× 1,000) | 18 |
Early neonatal mortality rate | Deaths under 7 days | Live births (× 1,000) | 13 |
Post-neonatal mortality rate | Deaths from 29 days to under 1 year | Live births (× 1,000) | 7 |
Stillbirth rate | Stillbirths | Live births + stillbirths (× 1,000) | 7 |
Perinatal mortality rate | Stillbirths + deaths under 7 days | Live births + stillbirths (× 1,000) | 20 |
Maternal mortality ratio | Maternal deaths | Live births (× 1,00,000) | 87 (2022-24) |
Maternal mortality rate | Maternal deaths | Women aged 15–49 (per lakh) | 5 (2022-24) |
Maternal death: death of a woman while pregnant or within 42 days of termination of pregnancy, irrespective of duration and site, from any cause related to or aggravated by the pregnancy or its management, but not from accidental or incidental causes.
MMR trend: 130 (2014-16) → 122 → 113 → 103 → 97 → 93 → 88 → 88 → 87 (2022-24). The SDG 3.1 target is below 70. By region: EAG states and Assam 116, South 41, Other 75. Madhya Pradesh is 135, Tamil Nadu 25. Three years are pooled because maternal deaths are too rare for a one-year estimate. Lifetime risk is 0.18%. Women aged 25–29 (36%) and 20–24 (30%) account for most maternal deaths.
Life expectancy at birth is 70.6 years, rural 69.4, urban 73.2.
Sex Ratio
Sex ratio is females per 1,000 males.
Overall, Census 2011: 943 in the final count (940 in the provisional totals, up from 933 in 2001).
Child (0–6), Census 2011 provisional: 914, down from 927, and the lowest since Independence.
At birth, SRS 2022-24: 918 (rural 914, urban 928).
Why the child ratio fell: son preference. NFHS-5 found that women with no sons who had an ultrasound were much more likely to go on to have a son than a daughter, which it calls clear evidence of son preference. Diagnosing the sex of a foetus is illegal under the PC-PNDT Act.
Population Dynamics of India
Census 2011: 1,21,08,54,977 people; growth 17.70% in 2001–11.
The only fall: 1911–21, at −0.31%. The fastest decade: 1961–71, at +24.80%.
Age structure, SRS 2024: 0–14 years 24.0%, 15–59 years 66.4%, 60+ 9.7%. NFHS-6 puts 60+ at 12.9%; quote each with its source.
Projection 2011–2036: 121.1 to 151.8 crore; 60+ from 8.4% to 15.0%; median age 24.9 to 34.7 years; sex ratio 943 to 957.
Population pyramid: as fertility falls the base narrows and the middle broadens.
Dependency ratio = (aged 0–14 + aged 60+) ÷ aged 15–59 × 1,000 in the official projections: 646 in 2011, projected 536 in 2036, with the young share falling (508 to 305) and the old share rising (138 to 231).
Literacy, Census 2011 provisional: 74.04%, up from 64.83%.
NFHS-6 versus NFHS-5 (NFHS-6 fieldwork covered 679,238 households; IIPS states these fact-sheet results are provisional):
Indicator | NFHS-5 (2019-21) | NFHS-6 (2023-24) |
Total fertility rate | 2.0 | 2.0 (urban 1.6, rural 2.1) |
Any contraceptive method | 66.7% | 69.1% |
Any modern method | 56.4% | 52.7% |
Female sterilization | 37.9% | 36.5% |
Male sterilization | 0.3% | 0.5% |
Total unmet need | 9.4% | 8.5% |
Institutional births | 88.6% | 90.6% |
Women 20–24 married before 18 | 23.3% | 20.1% |
Population aged 60 and above | 11.8% | 12.9% |
National Population Policy 2000
Objective | What it says |
Immediate | Address unmet needs for contraception, health care infrastructure and health personnel; integrated basic reproductive and child health care |
Medium-term | Bring the TFR to replacement level by 2010 |
Long-term | Achieve a stable population by 2045 |
Socio-demographic goals for 2010:
IMR below 30 per 1,000 live births; MMR below 100 per 1,00,000 live births.
80% institutional deliveries and 100% deliveries by trained persons.
Marriage of girls not earlier than 18, preferably after 20.
Free, compulsory school education up to age 14.
100% registration of births, deaths, marriage and pregnancy.
The policy set up a National Commission on Population chaired by the Prime Minister. Against today's data, IMR (24) and MMR (87) are now below the 2010 goals.
Traps the Examiner Sets
Ratio vs rate: maternal mortality ratio uses live births; maternal mortality rate uses women aged 15–49.
Stillbirth and perinatal rates use live births + stillbirths. Every other early-life rate uses live births alone.
GRR vs NRR: mortality is counted only in NRR. Replacement is NRR 1, not GRR 1.
TFR needs the × 5 when bands are five years wide.
Neonatal in the SRS definition means under 29 days.
Registration: 21 days, place of occurrence, not place of residence.
Do not mix sources: SRS IMR 24 and NFHS rates are different estimates. Check which the question names.
Memory Hooks & Shortcuts
Shortcuts to lock in this article's numbers and lists. Each one only re-packages facts proven above.
🧠 18-6-12, roughly — CBR 18.3 minus CDR 6.4 leaves natural growth 11.9
🧠 24, 18, 28 — IMR, NMR, U5MR for 2024: remember them in the order infant, newborn, under-five
🧠 Stillbirths bring their own denominator — stillbirth and perinatal rates add stillbirths to the live births below the line
🧠 Ratio has babies below the line, Rate has women — maternal mortality ratio over live births, rate over women aged 15–49
🧠 Gross ignores graves, Net counts them — GRR has no mortality, NRR does
🧠 Register where it happened, within 21 — CRS: place of occurrence, 21 days
🧠 10-45 — NPP 2000: replacement TFR by 2010, stable population by 2045
Rapid-Revision Cards
CBR formula
Live births ÷ mid-year population × 1,000. India 2024: 18.3.
GFR denominator
Mid-year women aged 15–49. India 2024: 63.6.
TFR formula
5 × sum of ASFRs ÷ 1,000 (five-year bands). India 2024: 1.9.
GRR vs NRR
Both count daughters per woman. Only NRR includes mortality.
Replacement level
TFR 2.1 or NRR 1.
Natural growth rate, India 2024
11.9 per 1,000 (CBR 18.3 − CDR 6.4).
IMR, NMR, U5MR, 2024
24, 18 and 28 per 1,000 live births.
Perinatal rate formula
(Stillbirths + deaths under 7 days) ÷ (live births + stillbirths) × 1,000. India 2024: 20.
Neonatal periods in SRS
Early: under 7 days. Late: 7 to under 29 days. Post-neonatal: 29 days to under 1 year.
Infant deaths in the first week
52.7% of infant deaths.
MMR 2022-24
87 per 1,00,000 live births. SDG 3.1 target: below 70.
MMR highest and lowest
Uttar Pradesh 154, Kerala 24.
Maternal mortality rate vs ratio
Rate: per lakh women aged 15–49 (5). Ratio: per 1,00,000 live births (87).
Life expectancy 2020-24
70.6 years: male 68.7, female 72.8. Kerala 75.6, Chhattisgarh 64.7.
Sex ratio at birth 2022-24
918 (Chhattisgarh 978, Uttarakhand 872).
Census 2011 sex ratio
943 final. Child (0–6) 914 provisional, lowest since Independence.
SRS method
Dual record: continuous enumeration + six-monthly survey, then matching.
Civil registration deadline
21 days, at the place of occurrence.
CRS forms
Form 1 live birth, Form 2 death, Form 3 stillbirth.
Census 2027 reference date
1 March 2027 (1 Oct 2026 snow-bound; 5 Jan 2027 Goa, UP, Punjab, rest of Uttarakhand).
Demographic stages
High stationary, early expanding, late expanding, low stationary, declining.
NPP 2000 objectives
Immediate: unmet needs. Medium: TFR replacement by 2010. Long: stable population by 2045.
NPP 2000 goals
IMR <30, MMR <100, 80% institutional deliveries, 100% by trained persons.
NFHS-6 headline
TFR 2.0; any method 69.1%; modern 52.7%; unmet need 8.5%; institutional births 90.6%.
Dependency ratio 2011 → 2036
646 → 536 per 1,000 aged 15–59.
Sources
Facts in this article were checked against these documents.
Sample Registration System Statistical Report 2024; SRS Bulletin Vol 59 No 1 (May 2026); Special Bulletin on Maternal Mortality 2022-24; Abridged Life Tables 2020-24 — Office of the Registrar General, India, 2026 (link)
Vital Statistics of India based on the Civil Registration System 2024 — Office of the Registrar General, India, 2026 (link)
National Family Health Survey (NFHS-6) 2023-24: India and State/UT Fact Sheets (provisional) — IIPS, MoHFW, May 2026 (link)
National Family Health Survey (NFHS-5) 2019-21: India Report — IIPS and ICF, 2021 (link)
Census 2011: Provisional Population Totals; Table A-2, Decadal Variation in Population since 1901 — Registrar General and Census Commissioner, 2011 (link)
Gazette notification S.O. 4919(E): Census of India 2027 reference dates — Ministry of Home Affairs, 5 September 2026
Population Projections for India and States 2011-2036 — National Commission on Population, MoHFW, 2020 (link)
National Population Policy 2000 — MoHFW, 2000 (link)
Demographic Yearbook Historical Supplement: technical notes on gross and net reproduction rates — United Nations Statistics Division, n.d. (link)
A 60 Second Guide to the Demographic Transition Model — Royal Geographical Society, n.d. (link)
Test Yourself: Practice Questions
Twenty-four questions in NEET PG style, with calculations first.
Practice Questions (NEET PG pattern)
Original questions written in the style of the exam: +4 for a correct answer, −1 for a wrong one. Every answer was checked against the sources listed above. NEET PG papers are not published by NBEMS, so these are not past-paper questions.
Q1. A town has a mid-year population of 2,00,000. In one year there are 3,600 live births and 1,300 deaths. Its natural growth rate per 1,000 population is
(a) 24.5
(b) 11.5
(c) 18.0
(d) 6.5
Show answer
Answer: (b) — CBR = 3,600 ÷ 2,00,000 × 1,000 = 18. CDR = 1,300 ÷ 2,00,000 × 1,000 = 6.5. Natural growth = 18 − 6.5 = 11.5 per 1,000.
Q2. A district reports 6,000 live births in a year. Its mid-year population is 3,00,000, of whom 75,000 are women aged 15–49. Its general fertility rate is
(a) 2.0 per woman
(b) 20 per 1,000
(c) 80 per 1,000
(d) 60 per 1,000
Show answer
Answer: (c) — GFR = live births ÷ mid-year women aged 15–49 × 1,000 = 6,000 ÷ 75,000 × 1,000 = 80. The 20 is the crude birth rate.
Q3. In a population, the age-specific fertility rates for the seven five-year bands from 15–19 to 45–49 add up to 400 per 1,000 women. The total fertility rate is
(a) 0.4
(b) 4.0
(c) 2.0
(d) 8.0
Show answer
Answer: (c) — TFR = 5 × sum of ASFRs ÷ 1,000 = 5 × 400 ÷ 1,000 = 2.0. The × 5 is there because each band covers five years.
Q4. A demographer wants a measure of daughters born per woman that accounts for the mortality of women before they finish child-bearing. The right measure is the
(a) net reproduction rate
(b) gross reproduction rate
(c) general fertility rate
(d) total fertility rate
Show answer
Answer: (a) — NRR differs from GRR because it takes mortality into account.
Q5. A net reproduction rate of 1 means that
(a) the crude birth rate equals 10
(b) each woman has one child
(c) the population has stopped ageing
(d) each generation of women exactly replaces itself
Show answer
Answer: (d) — An NRR of one indicates exact replacement; it is roughly equivalent to a two-child family.
Q6. In a block there were 2,000 live births, 40 stillbirths, 24 deaths under 7 days and 12 deaths from 7 days to under 1 year. The perinatal mortality rate is closest to
(a) 12 per 1,000
(b) 31 per 1,000
(c) 32 per 1,000
(d) 18 per 1,000
Show answer
Answer: (b) — (40 + 24) ÷ (2,000 + 40) × 1,000 = 64 ÷ 2,040 × 1,000 = 31.4. The denominator is live births plus stillbirths; 32 is the error of dividing by live births alone.
Q7. In another block there were 2,000 live births, 40 stillbirths, 24 deaths under 7 days and 12 deaths from 7 days to under 1 year. The infant mortality rate is
(a) 6 per 1,000 live births
(b) 12 per 1,000 live births
(c) 18 per 1,000 live births
(d) 30 per 1,000 live births
Show answer
Answer: (c) — IMR = infant deaths ÷ live births × 1,000 = 36 ÷ 2,000 × 1,000 = 18. Stillbirths are not counted in the IMR.
Q8. A baby dies on day 10 of life. In the SRS definitions this death counts in the
(a) post-neonatal mortality rate
(b) late neonatal mortality rate
(c) early neonatal mortality rate
(d) perinatal mortality rate
Show answer
Answer: (b) — Late neonatal = 7 days to under 29 days. Early neonatal is under 7 days; post-neonatal is 29 days to under 1 year.
Q9. The denominator of the maternal mortality rate, as distinct from the ratio, in SRS is
(a) total births
(b) live births
(c) women aged 15–49
(d) all women
Show answer
Answer: (c) — Maternal mortality rate is maternal deaths per lakh women aged 15–49. The ratio uses 1,00,000 live births.
Q10. According to the SRS Special Bulletin, India's maternal mortality ratio for 2022-24 is
(a) 97
(b) 87
(c) 103
(d) 130
Show answer
Answer: (b) — 87 per 1,00,000 live births, down from 88 in 2021-23 and 130 in 2014-16.
Q11. Among the major states in the SRS bulletin for 2022-24, the highest maternal mortality ratio is in
(a) Uttar Pradesh
(b) Madhya Pradesh
(c) Chhattisgarh
(d) Assam
Show answer
Answer: (a) — Uttar Pradesh 154, then Madhya Pradesh 135. Kerala has the lowest at 24.
Q12. Why are maternal mortality estimates in SRS pooled over three years?
(a) SDG reporting requires it
(b) Maternal deaths are rare, so one year's sample is too small
(c) The Census happens every three years
(d) Registration of deaths takes three years
Show answer
Answer: (b) — Maternal deaths are rare, and pooling three years of data yields reliable estimates.
Q13. A national survey counts births and deaths through a resident part-time enumerator and an independent six-monthly survey by a supervisor, then matches the two lists. This is the
(a) Census
(b) Sample Registration System
(c) Civil Registration System
(d) National Family Health Survey
Show answer
Answer: (b) — The SRS uses a dual record system; matching makes it self-evaluating.
Q14. A child is born at home in a village. Under the Registration of Births and Deaths Act, the birth must be reported within
(a) 21 days, at the parents' permanent address
(b) 7 days, at the place of occurrence
(c) 21 days, at the place of occurrence
(d) 30 days, at the nearest PHC
Show answer
Answer: (c) — Reported within 21 days; registered only at the place of occurrence. The head of the household reports events at home.
Q15. Which form is used to report a stillbirth to the Registrar?
(a) Form 4
(b) Form 1
(c) Form 3
(d) Form 2
Show answer
Answer: (c) — Form 1 live birth, Form 2 death, Form 3 stillbirth.
Q16. A country's death rate is falling rapidly, its birth rate remains high and its population is growing very fast. It is in the
(a) high stationary stage
(b) early expanding stage
(c) late expanding stage
(d) low stationary stage
Show answer
Answer: (b) — Stage 2, early expanding: birth rate high, death rate falling rapidly, very rapid increase.
Q17. The reference date for most of India in Census 2027 is 00:00 hours of
(a) 1 March 2027
(b) 1 April 2026
(c) 1 October 2026
(d) 1 January 2027
Show answer
Answer: (a) — 1 March 2027; 1 October 2026 for Ladakh and snow-bound areas; 5 January 2027 for Goa, Uttar Pradesh, Punjab and the rest of Uttarakhand.
Q18. The long-term objective of the National Population Policy 2000 is
(a) a population below 100 crore by 2030
(b) replacement-level TFR by 2010
(c) zero population growth by 2020
(d) a stable population by 2045
Show answer
Answer: (d) — Immediate: unmet needs. Medium-term: replacement TFR by 2010. Long-term: stable population by 2045.
Q19. Which was a National Population Policy 2000 goal for 2010?
(a) MMR below 100 per 1,00,000 live births
(b) Marriage of girls not before 21 years
(c) 60% institutional deliveries
(d) IMR below 10 per 1,000 live births
Show answer
Answer: (a) — Goals included IMR below 30, MMR below 100, 80% institutional deliveries, and marriage of girls not earlier than 18, preferably after 20.
Q20. India's sex ratio at birth for 2022-24 in SRS is
(a) 1,020
(b) 918
(c) 875
(d) 943
Show answer
Answer: (b) — 918 females per 1,000 males (rural 914, urban 928). 943 is the overall Census 2011 sex ratio.
Q21. India's total fertility rate in NFHS-6 (2023-24) is
(a) 1.9, down from 2.0
(b) 2.1, down from 2.2
(c) 2.0, unchanged from NFHS-5
(d) 2.2, up from 2.0
Show answer
Answer: (c) — 2.0 in both rounds (urban 1.6, rural 2.1). SRS 2024 gives 1.9; quote each with its source.
Q22. Compared with NFHS-5, NFHS-6 shows that use of any modern contraceptive method
(a) rose from 52.7% to 56.4%
(b) rose from 56.4% to 69.1%
(c) was unchanged
(d) fell from 56.4% to 52.7%
Show answer
Answer: (d) — Any method rose (66.7% to 69.1%) but modern methods fell, because traditional-method use rose. NFHS-6 fact-sheet results are provisional.
Q23. A population has 30 lakh people aged 0–14, 60 lakh aged 15–59 and 10 lakh aged 60 and above. Using the method in the official projections, the total dependency ratio per 1,000 is about
(a) 1,500
(b) 667
(c) 600
(d) 400
Show answer
Answer: (b) — (30 + 10) ÷ 60 × 1,000 = 667. Young plus old, over the working-age group 15–59.
Q24. The only census decade in which India's population fell was
(a) 1961–71
(b) 1941–51
(c) 1971–81
(d) 1911–21
Show answer
Answer: (d) — 1921: −0.31%. The fastest growth was 1961–71 at +24.80%.
Active Recall
From memory: list the current India values for CBR, CDR, TFR, IMR, NMR, U5MR, MMR and sex ratio at birth with their sources; write the formulas for GFR, TFR, perinatal mortality and the maternal mortality ratio with the right denominators; describe the five demographic stages, the SRS dual record system, the civil registration rules, and the objectives of National Population Policy 2000.